
TLDR
4 years designing mission-critical communications infrastructure tools for police, fire, and emergency services. Consolidated 32 fragmented legacy applications into unified workflows for network engineers. Created monitoring portals serving two audiences (technical experts and non-technical decision-makers). Built workload visualization tools making operational tradeoffs legible to public safety agencies.
Challenge: Make complexity legible in systems that cannot fail—supporting verification and double-checking without creating friction.
The Mission-Critical Infrastructure Problem
Motorola Solutions builds communications infrastructure for public safety: radio systems, dispatch tools, network management software that first responders use to coordinate. This work happens in the background—invisible when it works, catastrophic when it fails.
The operational reality:
- Systems cannot go down—public safety depends on them
- Network engineers deploy and configure radio infrastructure
- Service technicians monitor managed services
- Operations teams coordinate public safety response
- Customers include city governments, counties, transit authorities
The legacy challenge:
- 32+ different configuration tools (outdated, unsupported browsers, cross purposes)
- Inconsistent terminology and workflows across tools
- Training new engineers took months
- Data integrity suffered
- Simple tasks required remembering which of dozens of tools to use
The dual-audience problem:
- Technical experts needed precise control and detailed system data
- Non-technical decision-makers (budget committees, elected officials) needed to understand system health and service value
- Interface served as translation layer between expertise and oversight
The design tension: Precision ↔ Clarity
Expert users need interfaces matching how they think about work—preserving precision and control expertise requires. But complexity must be legible, not hidden. How do you reduce unnecessary friction while maintaining verification capabilities that prevent catastrophic errors?
My progression:
2014-2017: UX & UI Designer — Service Automation team designing configuration tools for Land Mobile Radio (LMR) systems. Led consolidation of 32 legacy applications.
2017-2018: Senior UX Designer — CTO Design Innovation Team. Led UX architecture for MyView Portal. Expanded scope to service design leadership and vendor liaison.
What I Worked On
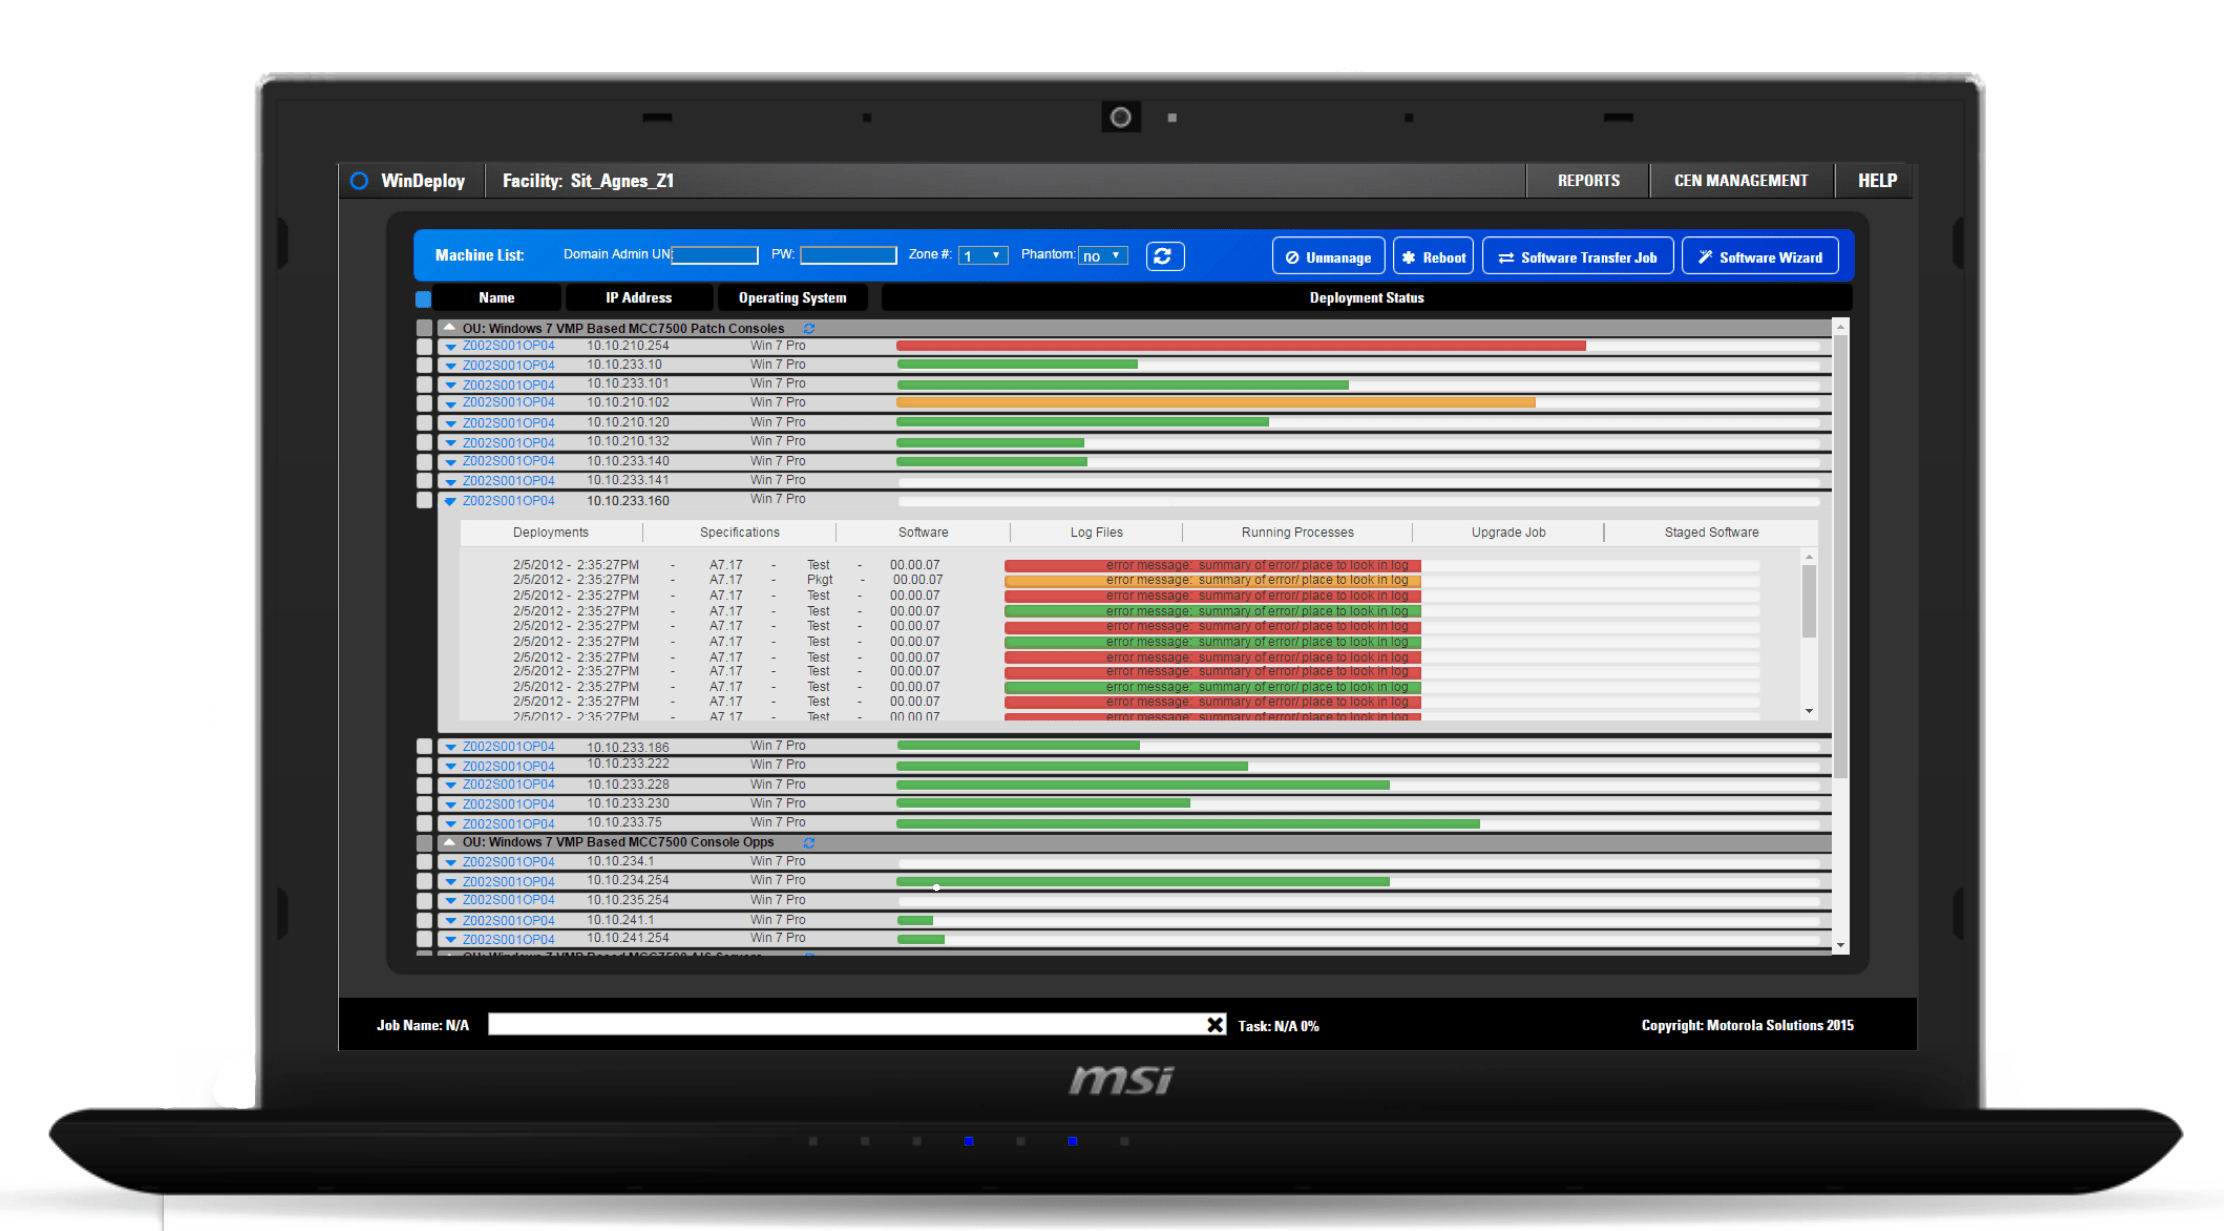
Consolidating Legacy Tools (2014-2017)
Problem: 32+ configuration tools with inconsistent terminology, workflows, browser support. Training took months. Data integrity suffered. Network engineers couldn’t remember which tool for which task.
Solution: Led design of unified tool suite consolidating fragmented workflows.
Design approach — Understanding mental models, designing for verification, standardizing patterns
Understanding mental models: Spent time with network engineers understanding how they reasoned about radio systems—which conventions were load-bearing, which could change.
Designing for verification: LMR configurations can’t fail. Every setting has downstream consequences for public safety. Interface needed to support double-checking without creating friction.
Standardizing patterns: Shared structure where tasks were similar enough. Left variance only where it reflected actual differences in work.
Making system state visible: Network topology, frequency assignments, coverage analysis inherently complex. Goal: reveal structure, not obscure it.
What changed — Modern tools, faster training, improved data integrity
Network engineers configured systems using modern web tools instead of maintaining 32 different applications. Training new engineers faster because patterns consistent across workflows. Data integrity improved because system enforced relationships previously implicit.
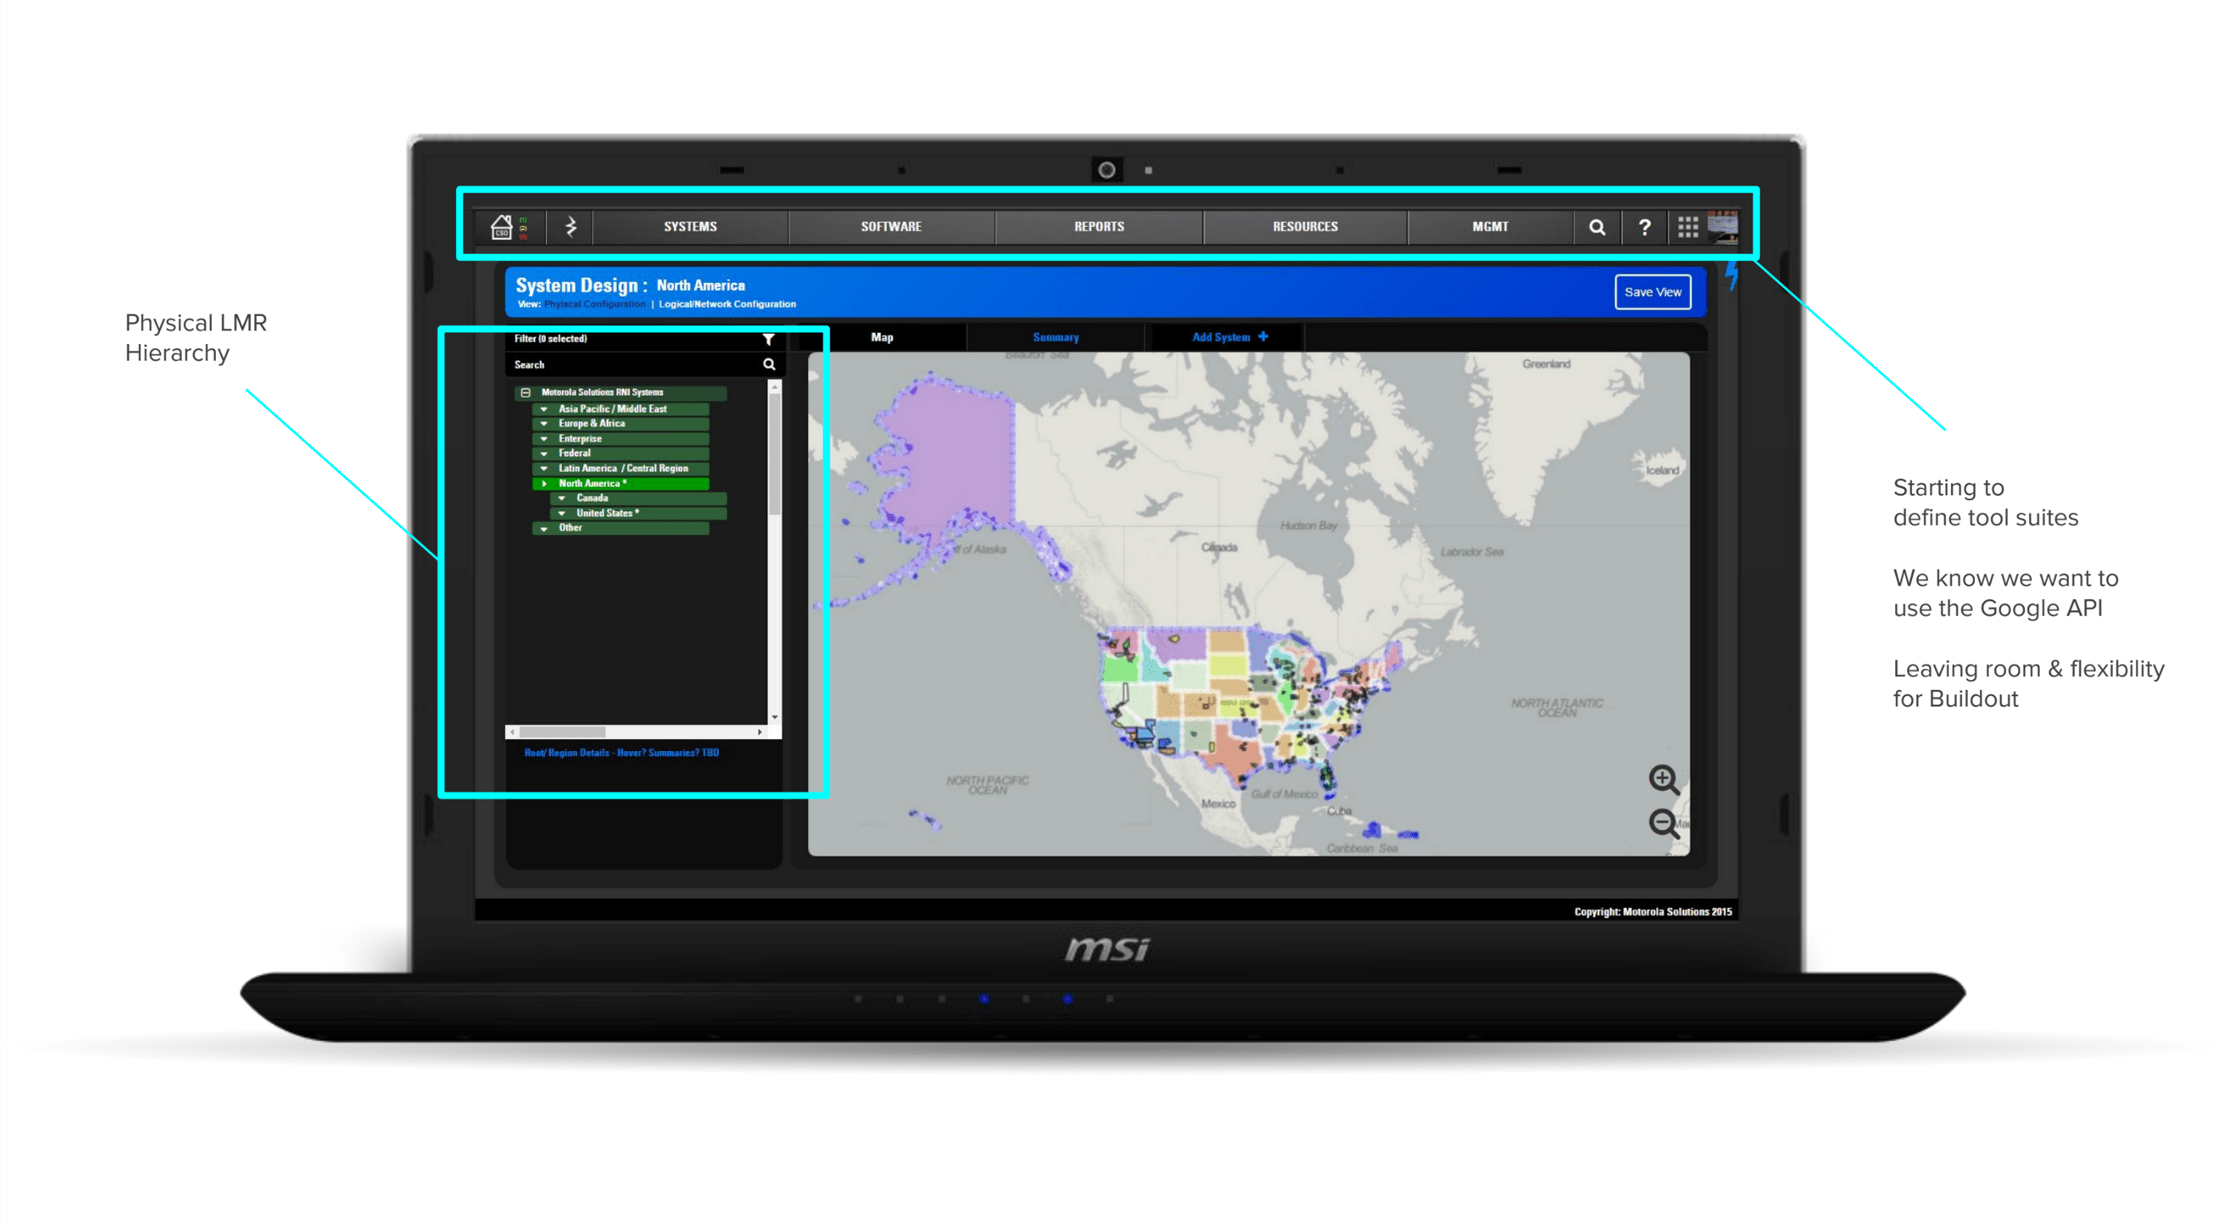
MyView Portal: Monitoring for Two Audiences (2017-2018)
The situation: Managed services customers—city governments, counties, transit authorities—needed visibility into LMR infrastructure. System health, service tickets, maintenance schedules, SLA compliance. But also needed to explain system status to budget committees and elected officials who didn’t understand radio engineering.
Field research insight: Service agents were turning screens toward customers during meetings. Showing maintenance history to justify service decisions. Pointing at dashboards to explain why repairs took three days. Interface wasn’t just operational tool—it was how technical experts and non-technical decision-makers built shared understanding.
Design approach: Designed MyView Portal to serve both audiences without compromising either.
How it worked — Dual-mode architecture, accurate-yet-accessible visualizations, professional design
Information architecture: Supported overview and drill-down. Dashboard views for executives, detailed system data for technicians.
Visualizations: Accurate enough for experts but didn’t require radio engineering knowledge to interpret. SLA tracking, incident timelines, system health indicators.
Visual design: Reflected seriousness of service contract. Customers paid substantial money for managed services—portal needed to look and feel professional.
What I delivered — UX architecture, prototypes, design system, offshore collaboration
- UX architecture and detailed wireframes
- Interactive prototypes for stakeholder review
- Design system components development teams could implement consistently
- Ongoing collaboration with offshore development teams
What changed — Self-service status, reduced support calls, service delivery integration
Customers could check system status themselves instead of calling support. Service agents spent less time explaining basics, more time solving problems. Portal became part of how Motorola delivered managed services, not just reported on them.
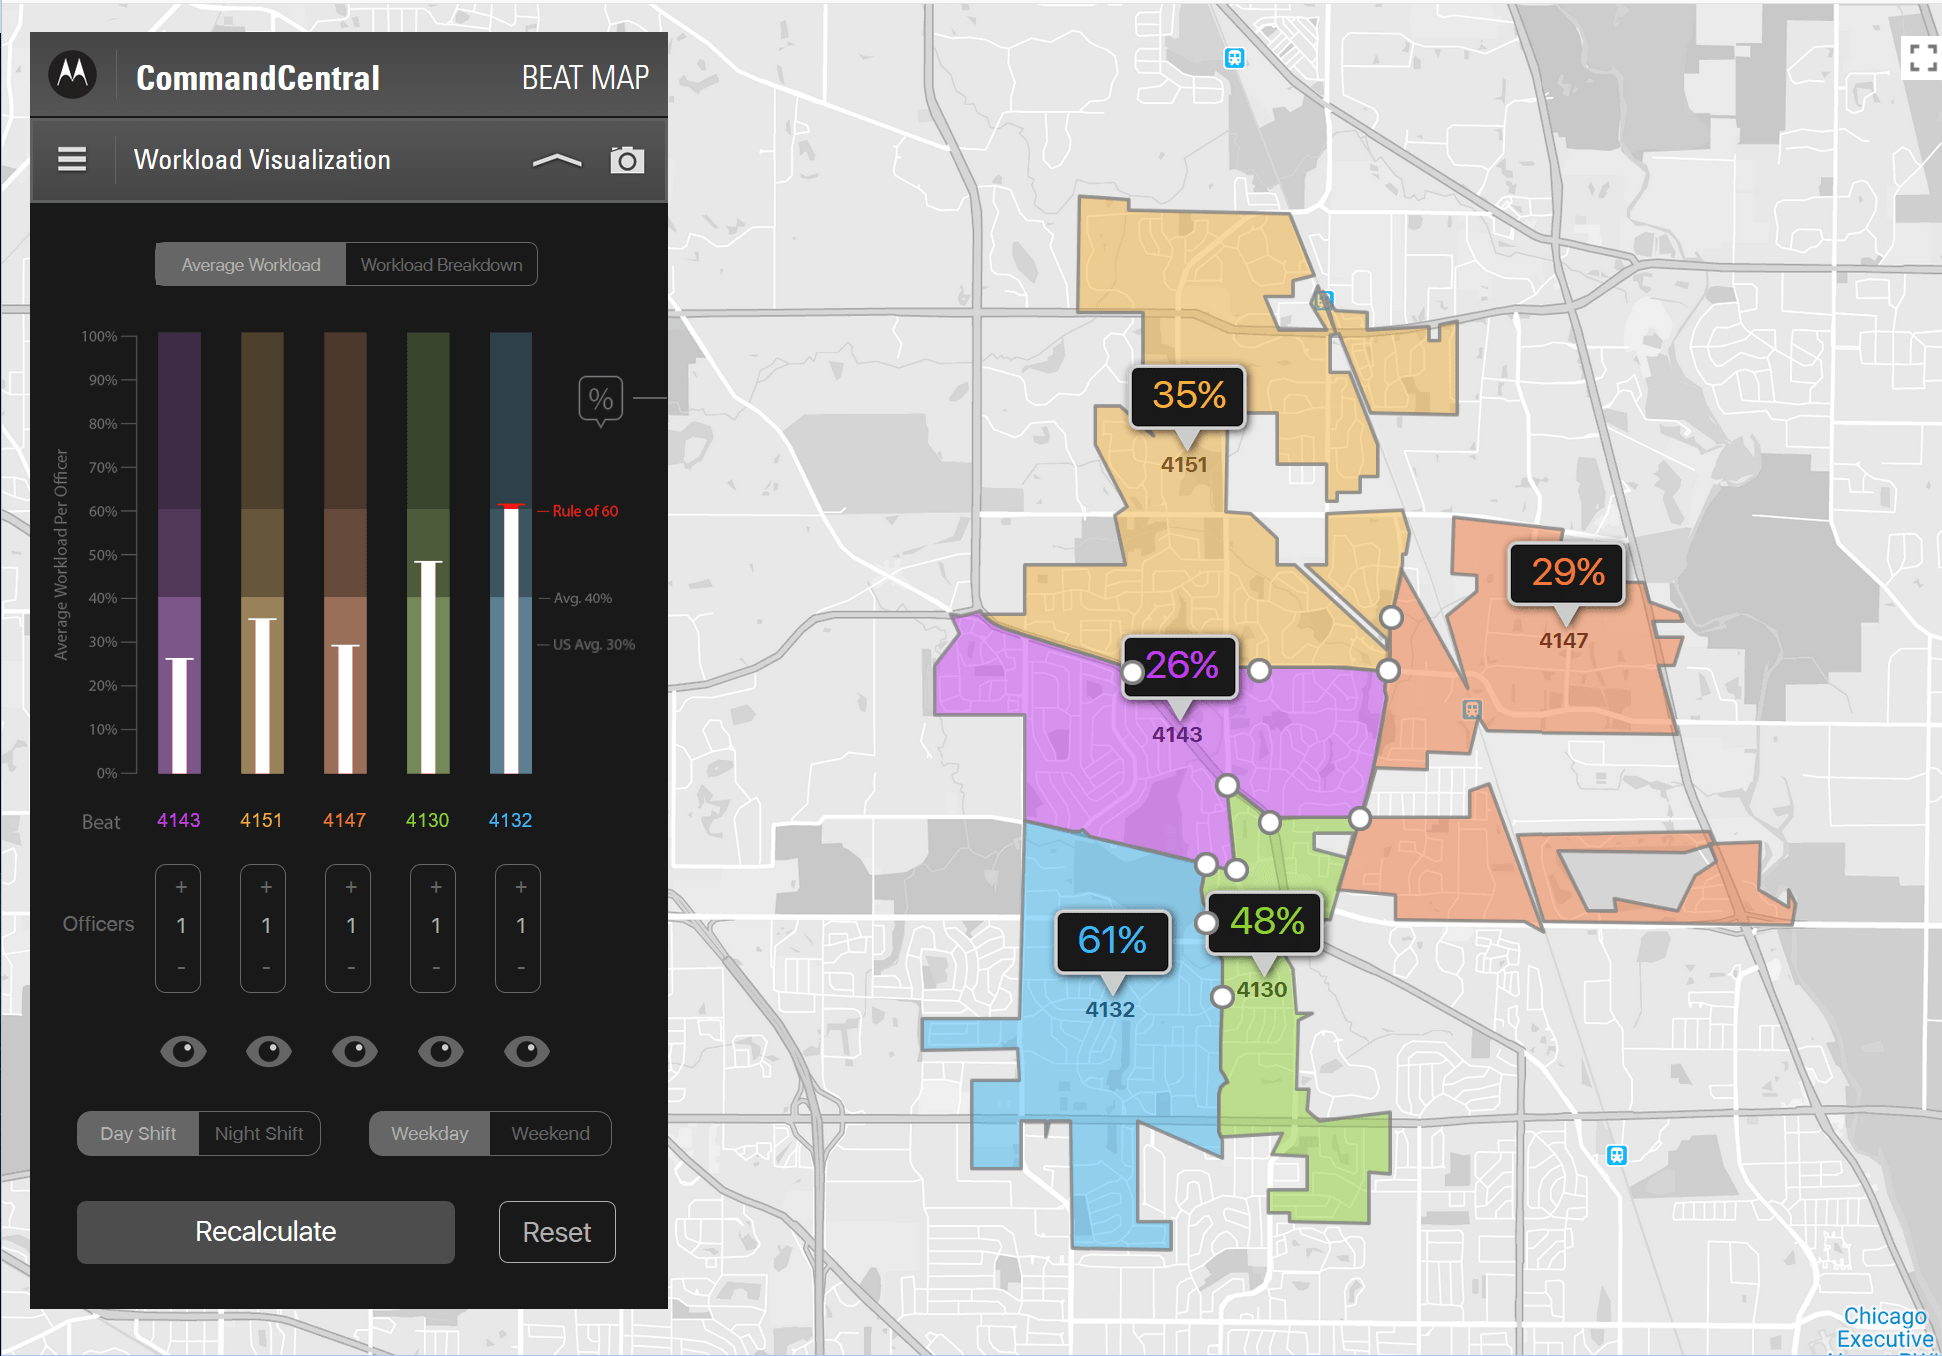
Dynamic Beat Mapping: Making Workload Visible
The gap: Public safety agencies needed to understand workload distribution across geography. Where are incidents happening? How do patrol areas compare in demand? Are staffing levels matched to need? Existing tools showed raw incident counts but didn’t make tradeoffs visible—agencies couldn’t see how geography, staffing, and demand interacted over time.
Solution: Workload visualization tool making operational tradeoffs legible.
How it worked — Temporal patterns, meaningful comparisons, what-if analysis
Temporal patterns: Demand by time of day, day of week, season.
Meaningful comparisons: Not just “Beat A has more incidents” but “Beat A has 40% more demand with 20% less staffing.”
What-if analysis: “If we redraw beat boundaries, how does workload distribution change?”
Impact — Data-informed planning, shared understanding of tradeoffs
Agencies used tool to inform beat redesigns and staffing decisions. Shifted operational planning from institutional memory to data-informed tradeoffs. Created shared understanding between patrol operations and command staff about what “balanced workload” actually meant.
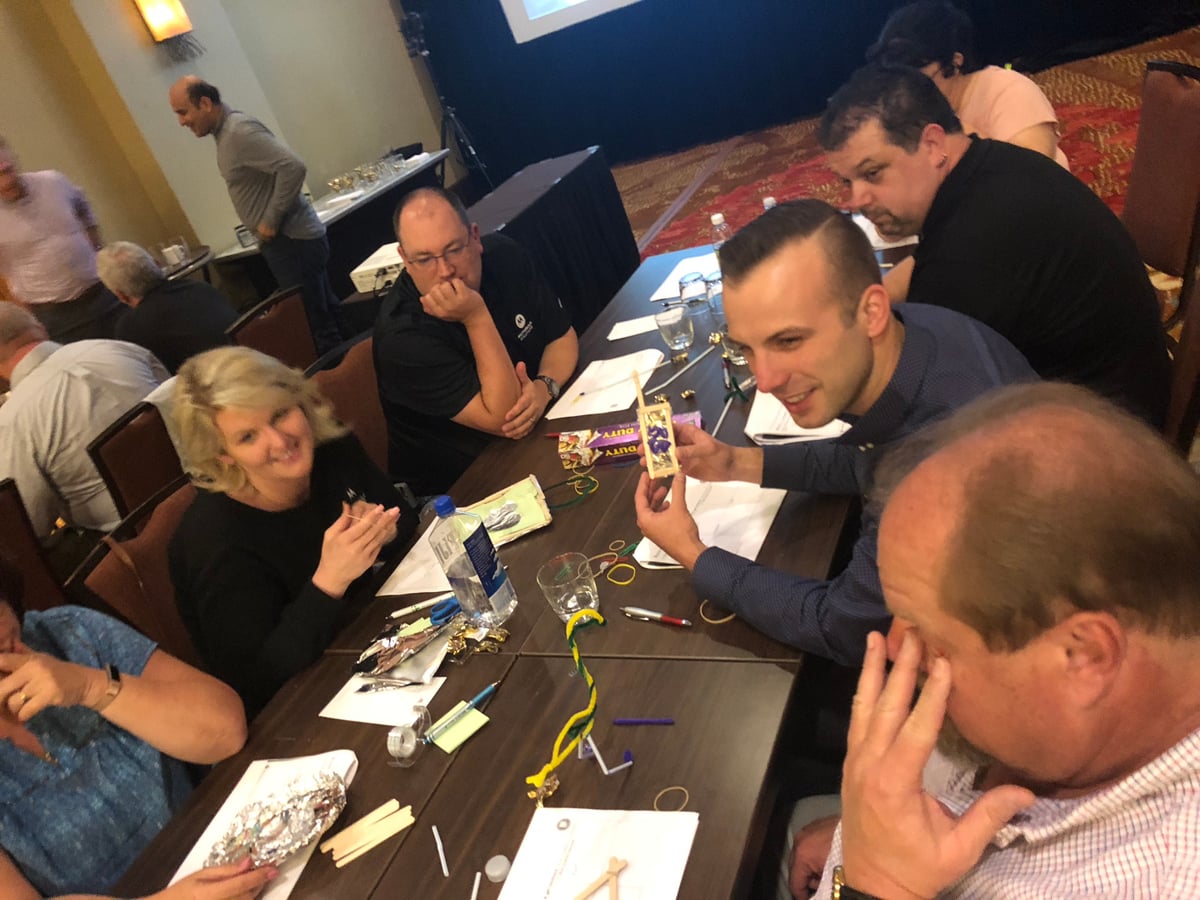
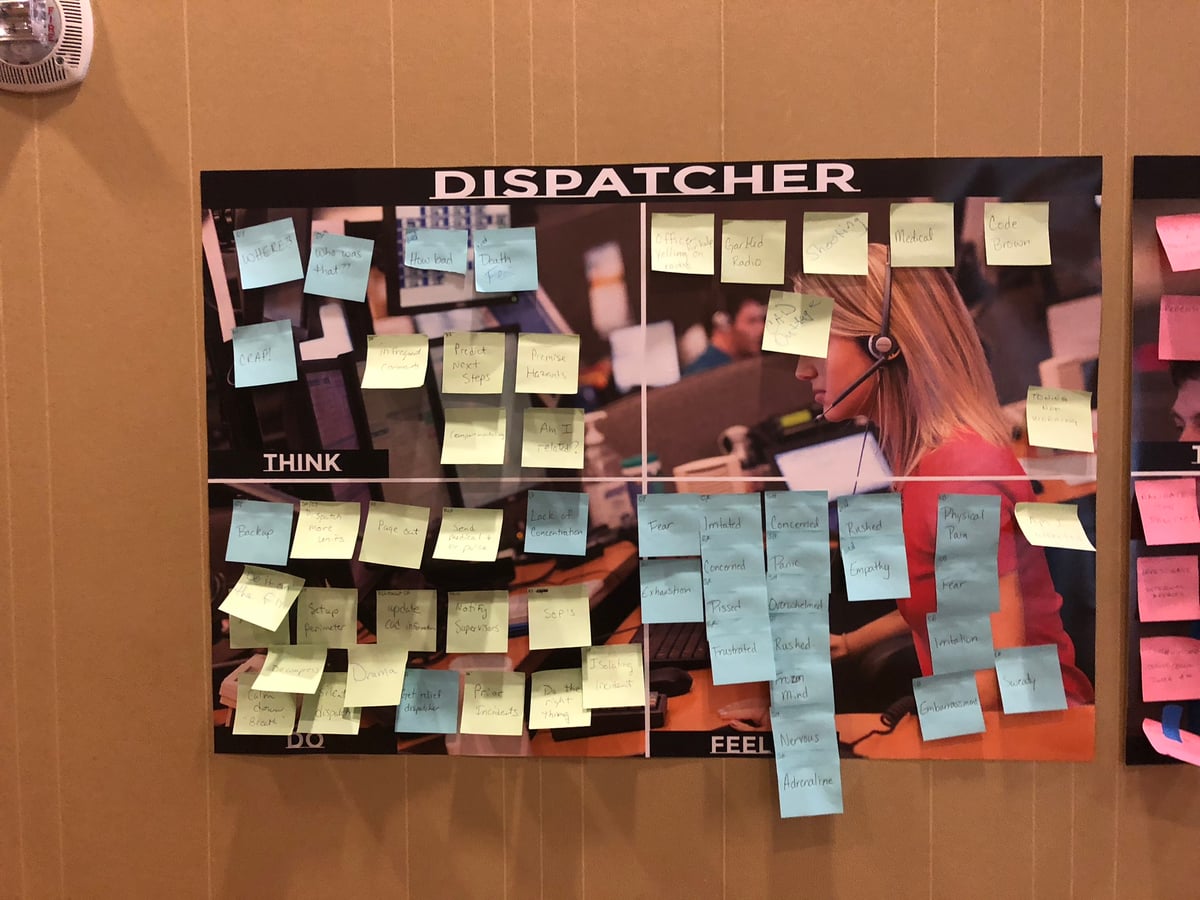
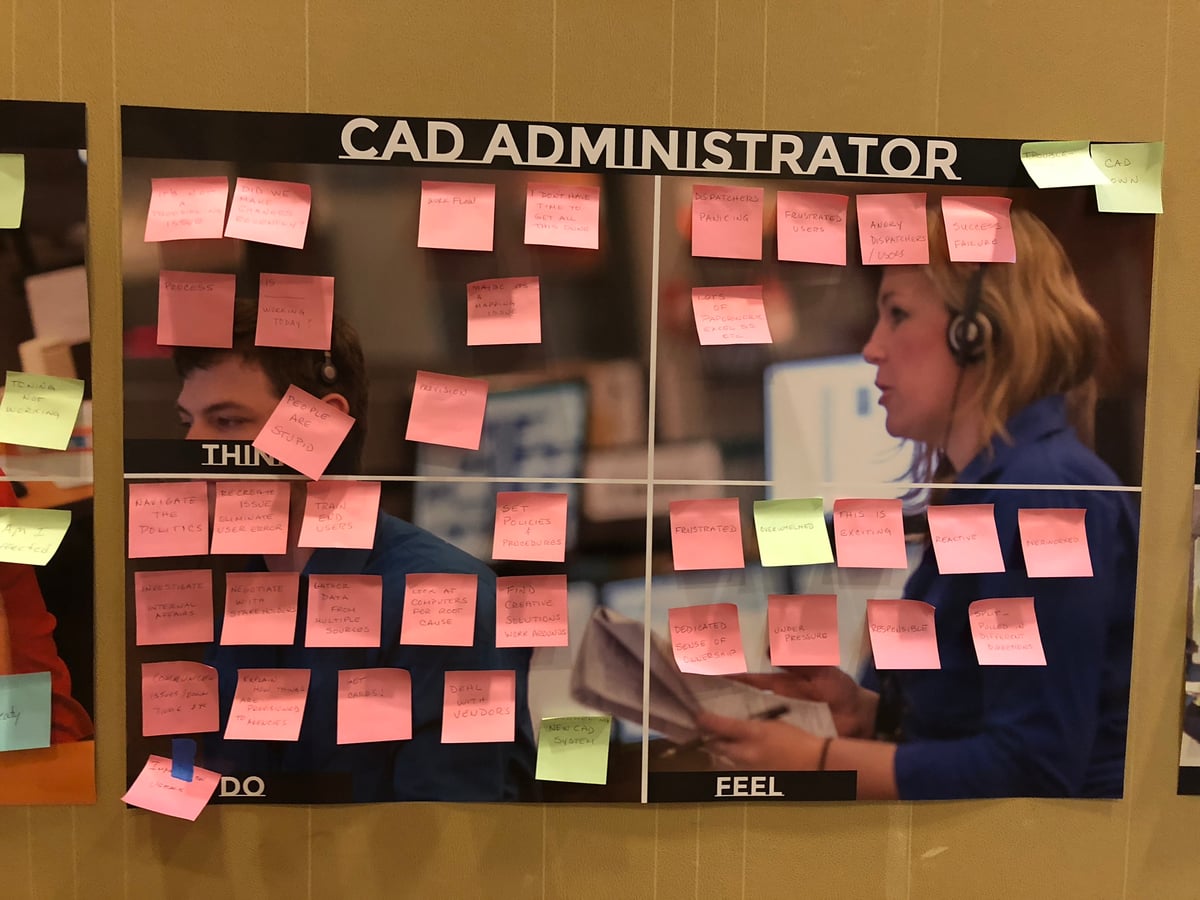
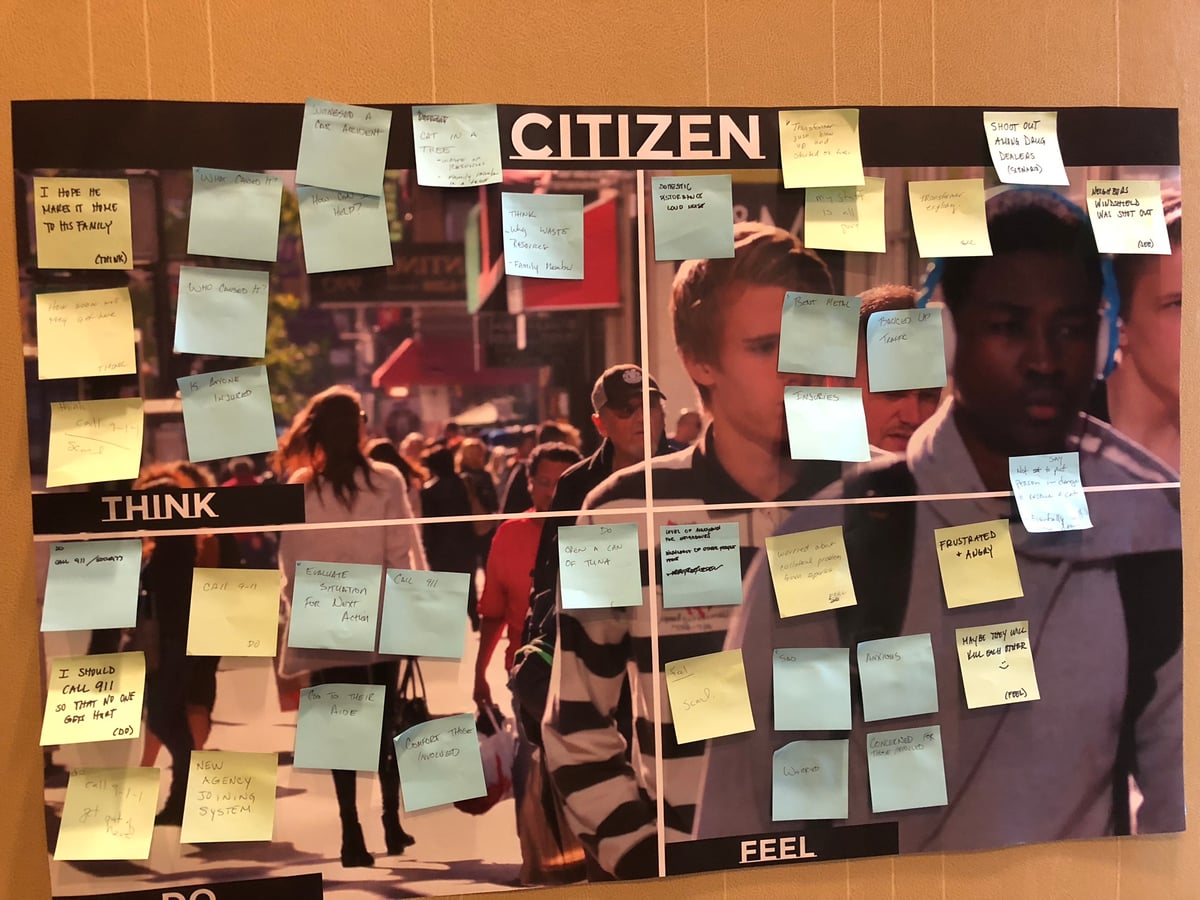
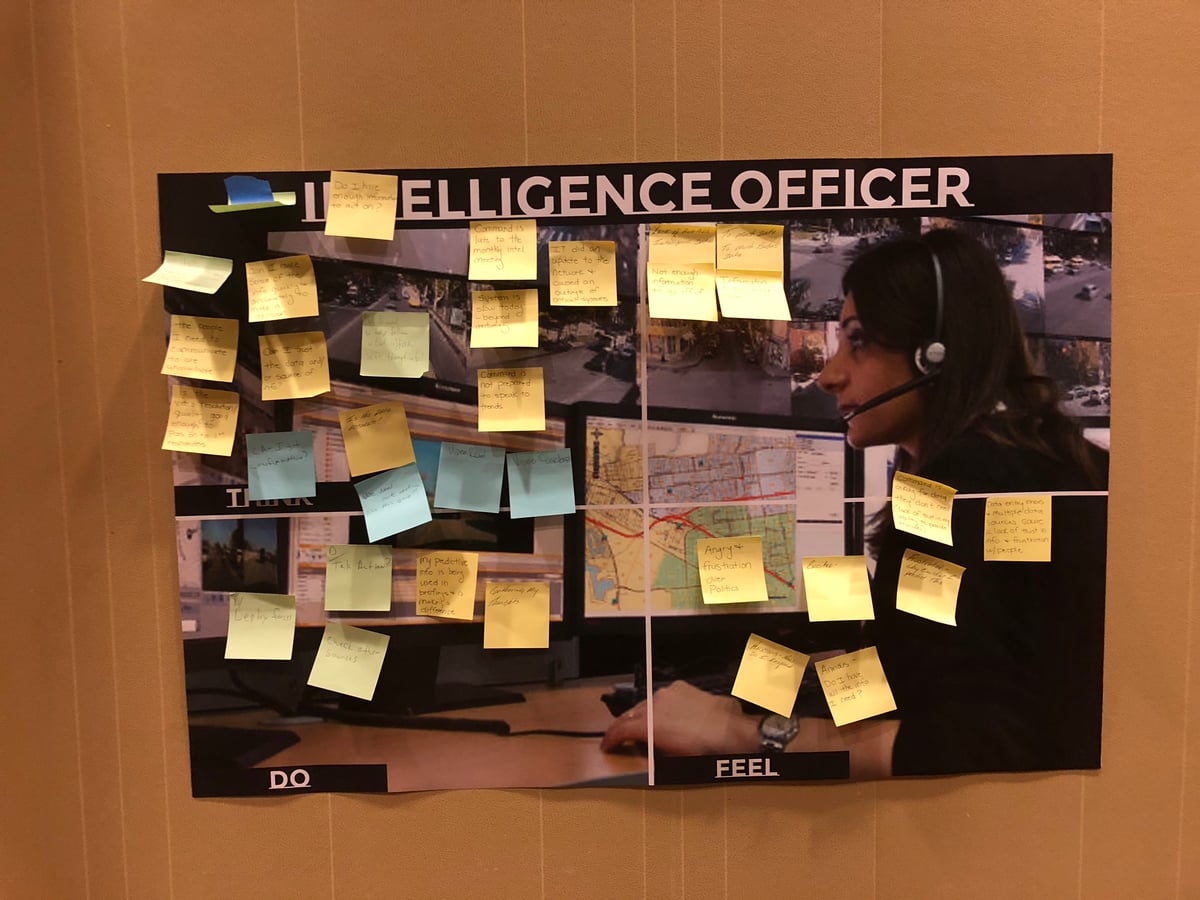
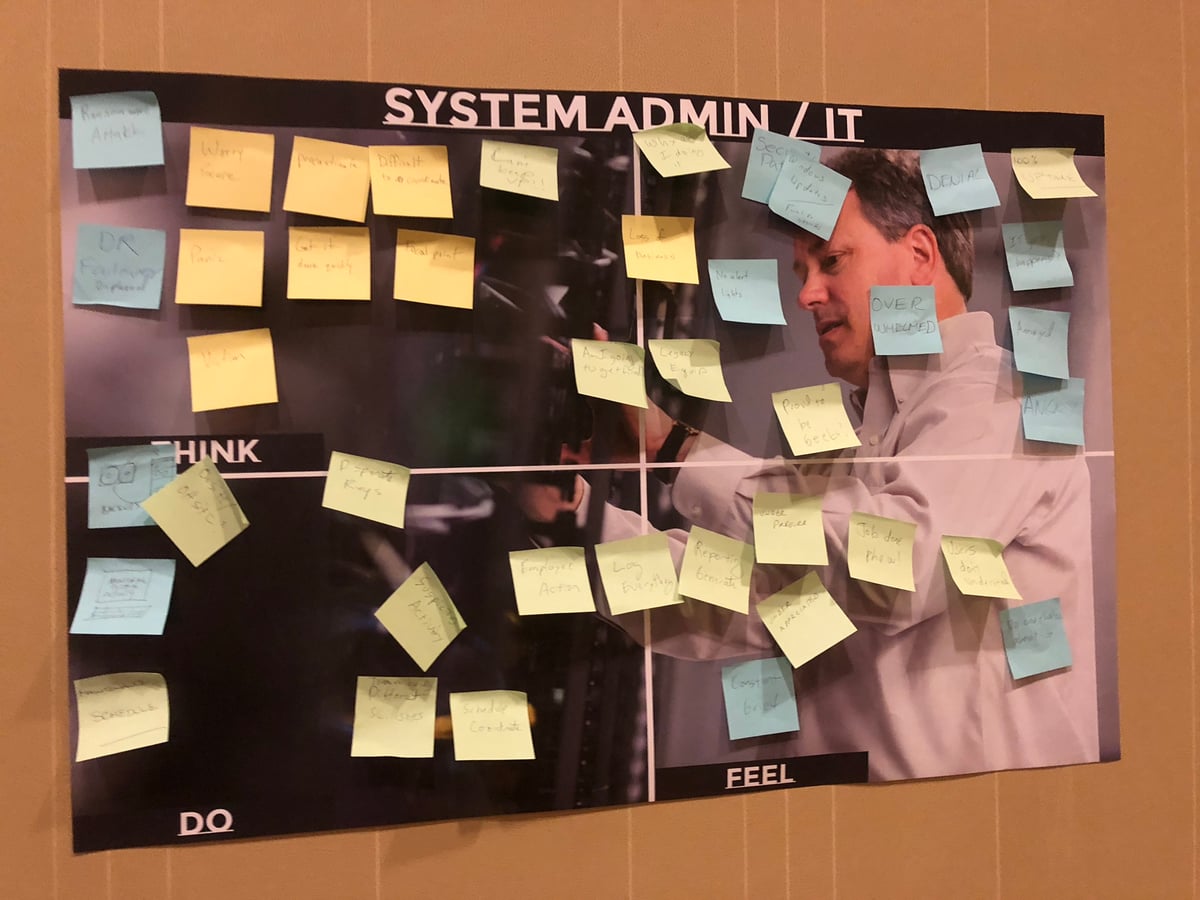
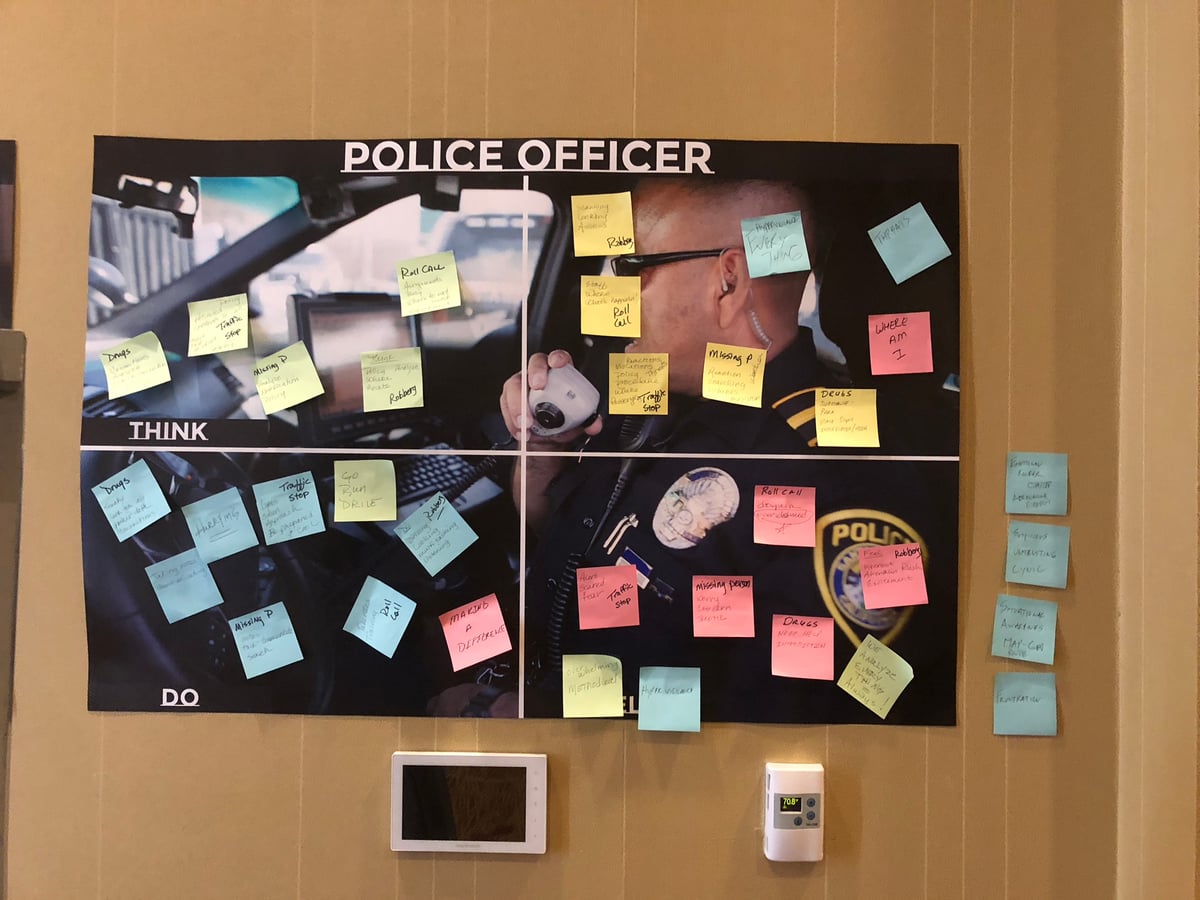
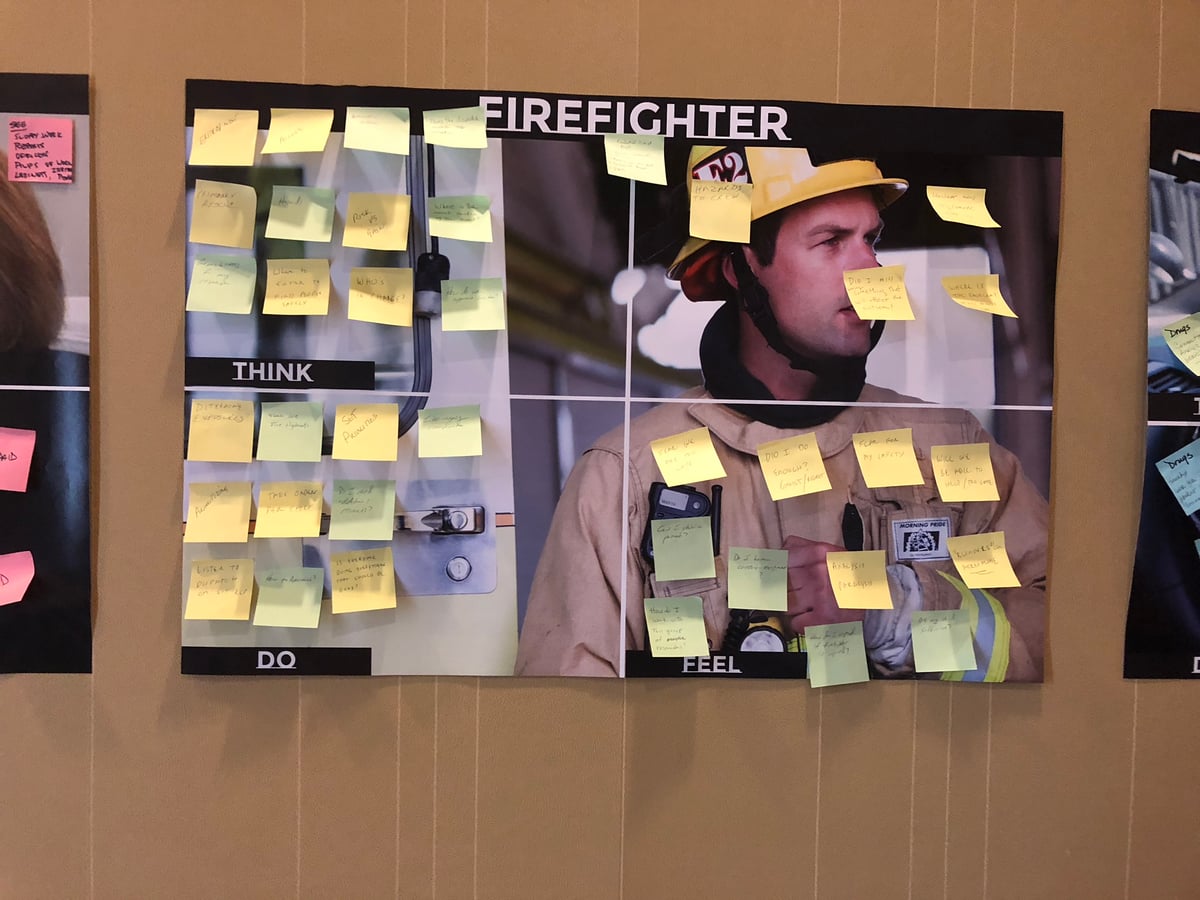
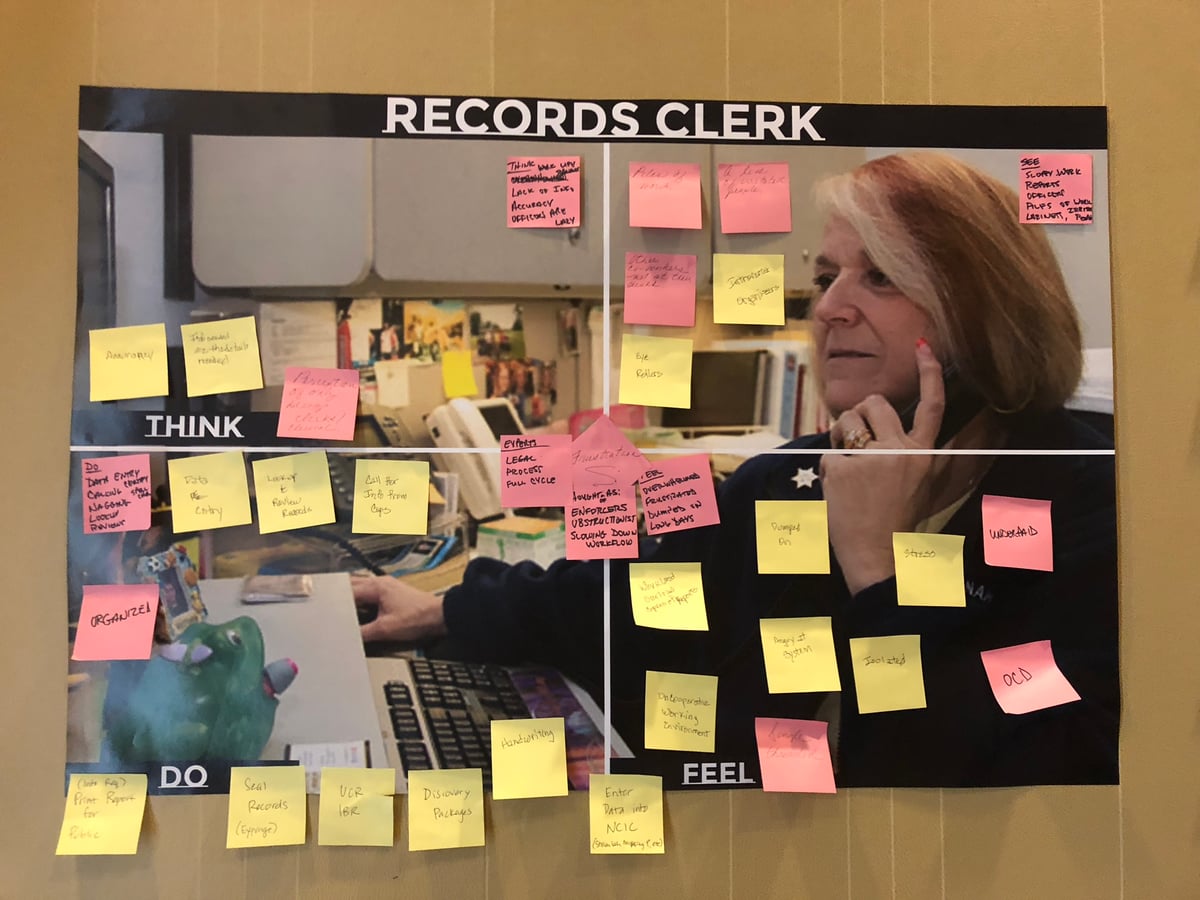
Software Learning Summit: Building Shared Language
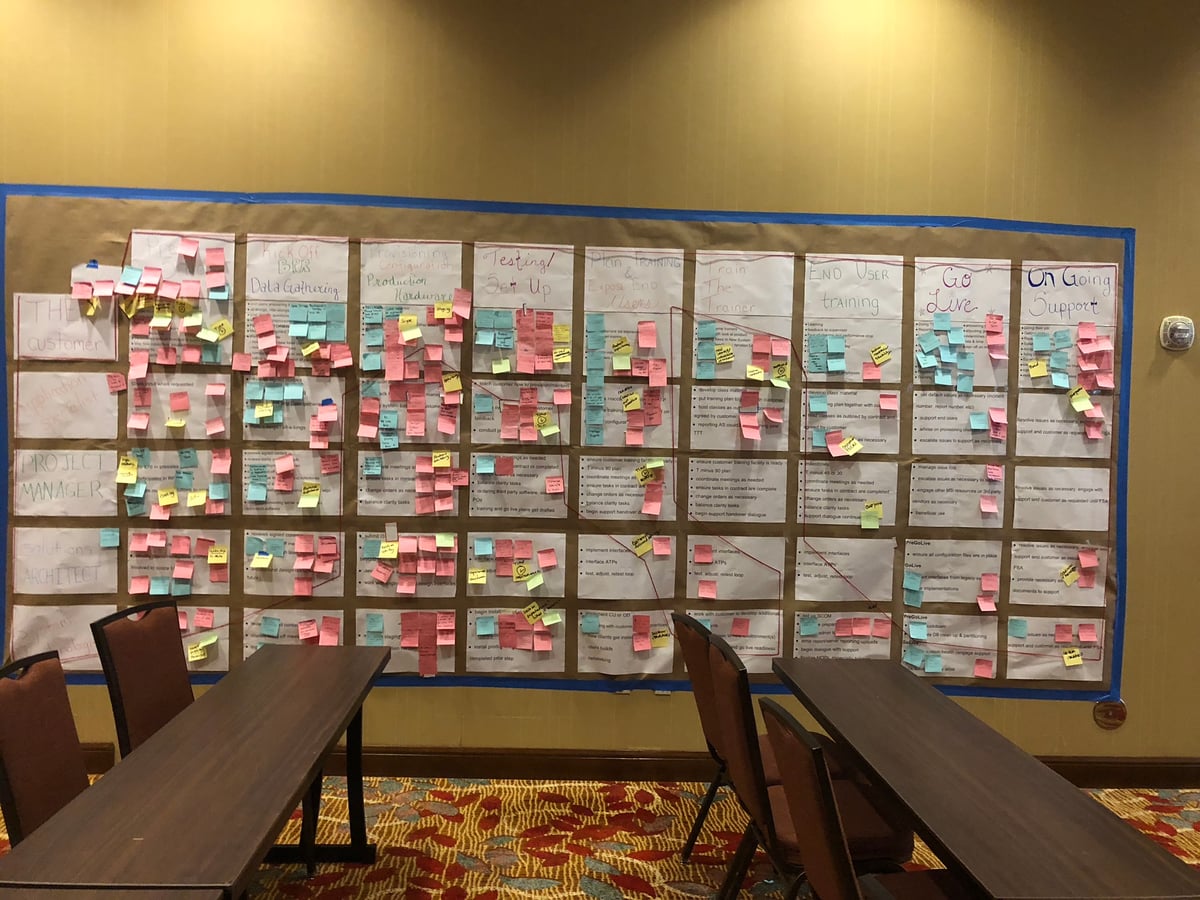
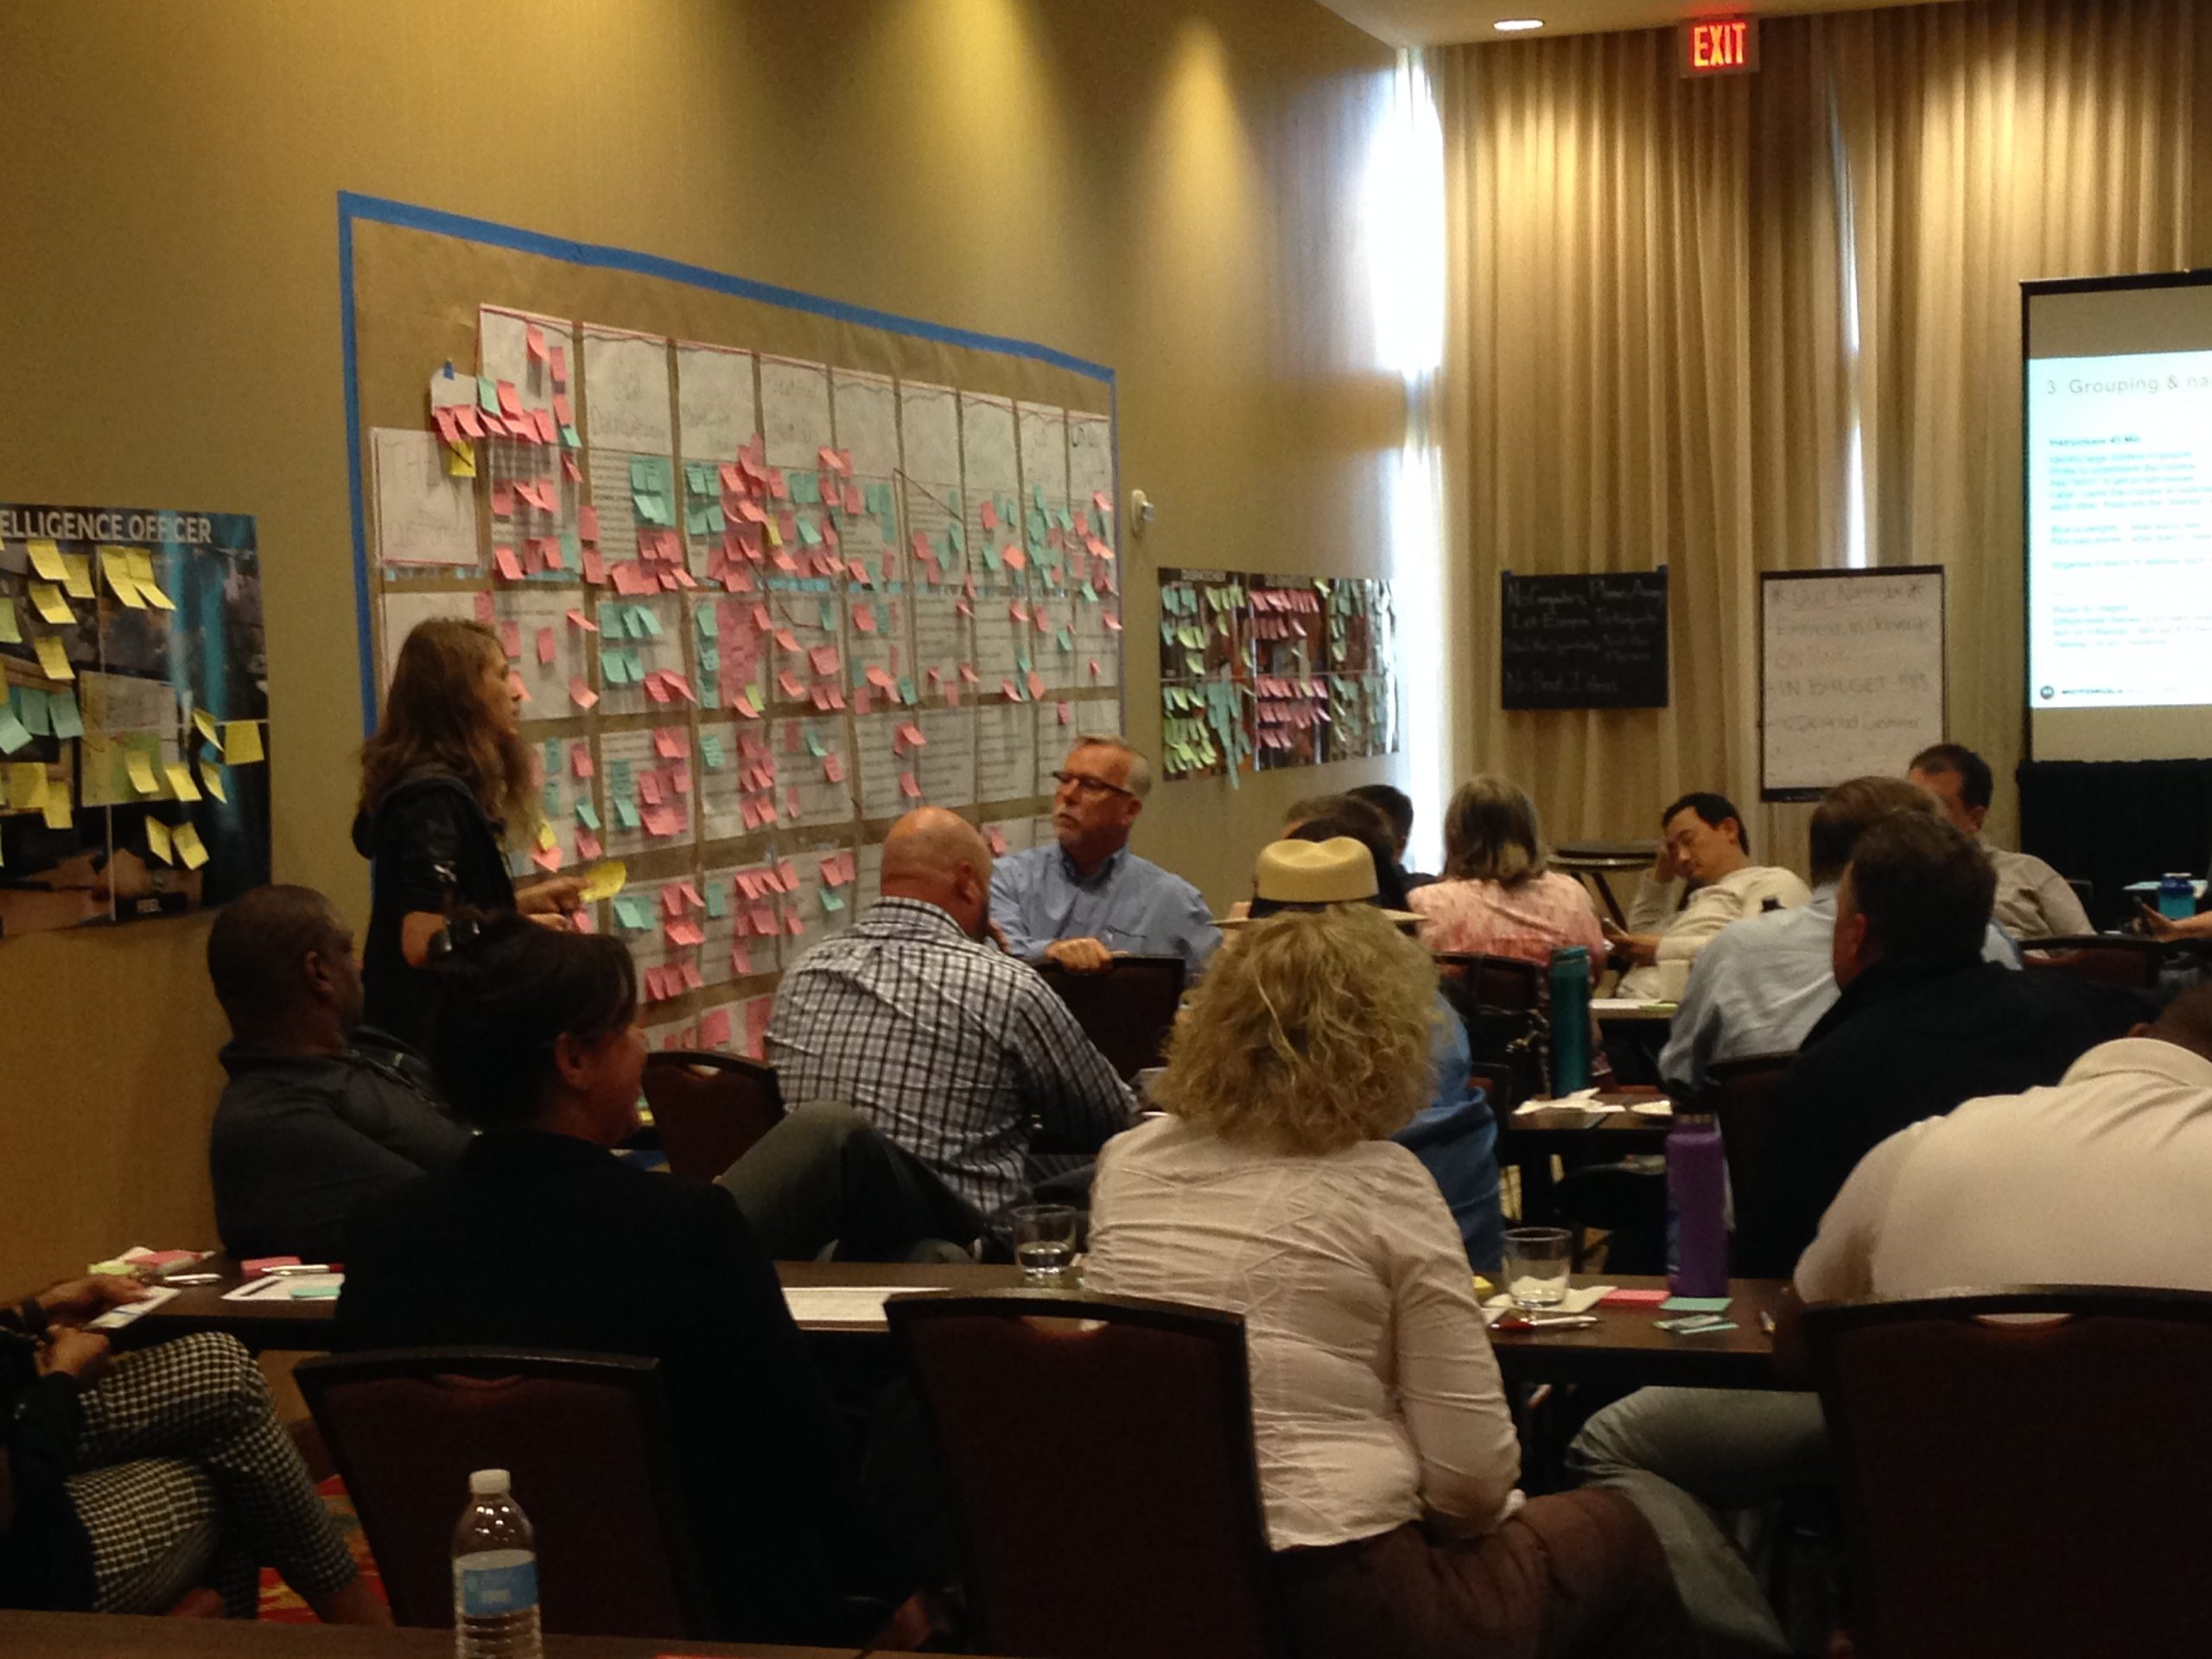
Led internal workshops teaching design methods to engineers and product teams. Introduced collaborative practices—journey mapping, affinity diagramming, lo-fi prototyping—as tools for reducing uncertainty when building new systems.
Approach — Shared understanding over conversion
Emphasis on shared understanding rather than conversion. Engineers didn’t need to become designers, but we needed common language for talking about user needs and ways to test assumptions before writing code.
Sessions: Design Thinking 101, Lo-Fi Prototyping for Beginners, Journey Mapping, Persona Development.
Design Principles That Emerged
Precision ↔ Clarity: Expert users need interfaces matching how they think about work—preserving precision and control expertise requires. But complexity must be legible, not hidden. Remove unnecessary friction while maintaining verification capabilities that prevent catastrophic errors.
Interfaces Are Infrastructure: When systems are mission-critical, design isn’t about delight or engagement. It’s about reducing effort required to verify decisions, making failures visible before they propagate, supporting careful double-checking that prevents errors from becoming disasters.
Expert Users Need Different Things Than Novices: Network engineers and service technicians are highly skilled professionals. They didn’t need simplified interfaces—they needed interfaces matching how they already thought about work. Design task: remove unnecessary friction while preserving precision and control expertise requires.
Constraints Clarify Priorities: Working with legacy systems, compliance requirements, distributed development teams meant I couldn’t always design ideal solutions. This forced thinking harder about what truly mattered—which conventions were load-bearing, which variance was meaningful, which simplifications would break expert workflows.
Research Is About Watching, Not Asking: The MyView insight—service agents turning screens toward customers—only emerged because I watched people use the tool in actual meetings. Most useful research findings are ones you didn’t know to look for.
Dual-Audience Design Requires Non-Compromise: MyView Portal served technical experts needing detailed data AND non-technical decision-makers needing comprehensible status. Success required serving both audiences fully, not finding middle ground that satisfied neither.
What Changed
Legacy Tool Consolidation:
- 32 separate configuration tools → unified web-based tool suite
- Training time reduced (months → weeks through consistent workflows)
- Improved data integrity (system enforced previously implicit relationships)
MyView Portal:
- Customers checked system status themselves vs. calling support
- Service agents spent less time explaining basics, more solving problems
- Portal became service delivery mechanism, not just reporting tool
Dynamic Beat Mapping:
- Public safety agencies made data-informed staffing decisions vs. relying on institutional memory
- Shared understanding of workload tradeoffs between patrol operations and command staff
Software Learning Summit:
- Product and engineering teams gained shared language and methods for testing assumptions early
- Design thinking integrated into development process
Technical Environment
Tools: Illustrator, Axure, Sketch, prototyping tools
Tech: .Net C#, Team Foundation Server, Bootstrap, Telerik Controls, AngularJS
Methods: Field research, usability testing, collaborative design workshops, LUMA certified
Teams: Service Automation Team, System Integration Engineers, Upgrade Operations Engineers, CTO Design Innovation Team
Domain: Public safety communications, Land Mobile Radio (LMR) systems, managed services, emergency response coordination